Class 9 · MathsNCERT 2026 Revised Syllabus
Chapter 10: How Quantities Combine: Understanding Data (0904CH10)
Exercise Set 10.4 — 2 questions with step-by-step notebook-style answers.
Jump to:
Exercise Set 10.4(2 questions)
1
The following stacked column chart shows the number of animal species in the IUCN Red List, by class, over time.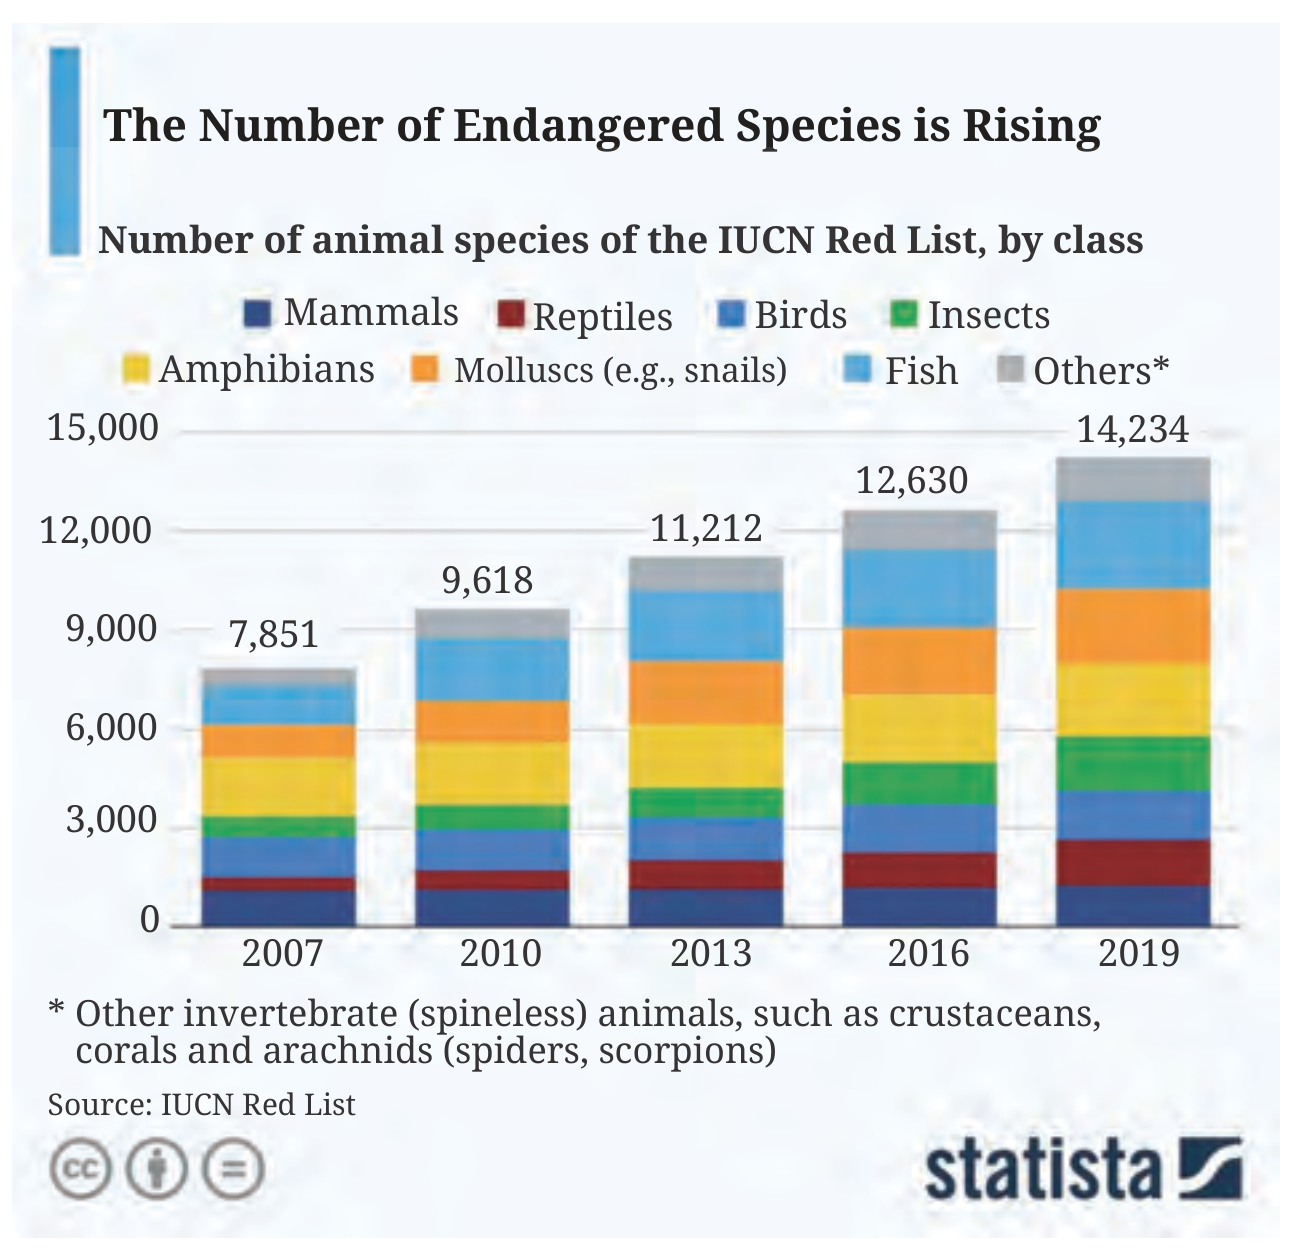
The International Union for Conservation of Nature (IUCN) Red List is a large, regularly-updated database that tells us the extinction risk of species across the world. It classifies species into groups such as Least Concern, Vulnerable, Endangered, Critically Endangered, Extinct in the Wild and Extinct, based on scientific data about their numbers, trends and habitats.(i) What does the number 14,234 on the top of the column 2019 represent? (ii) Approximately how many reptile species were in the list in 2016? (iii) Which class(es) of species have seen a relatively small increase in count between 2007 and 2019?
School Level Solution
NoteThese are approximate values according to visual perception. Answers may vary and are not to scale.
2
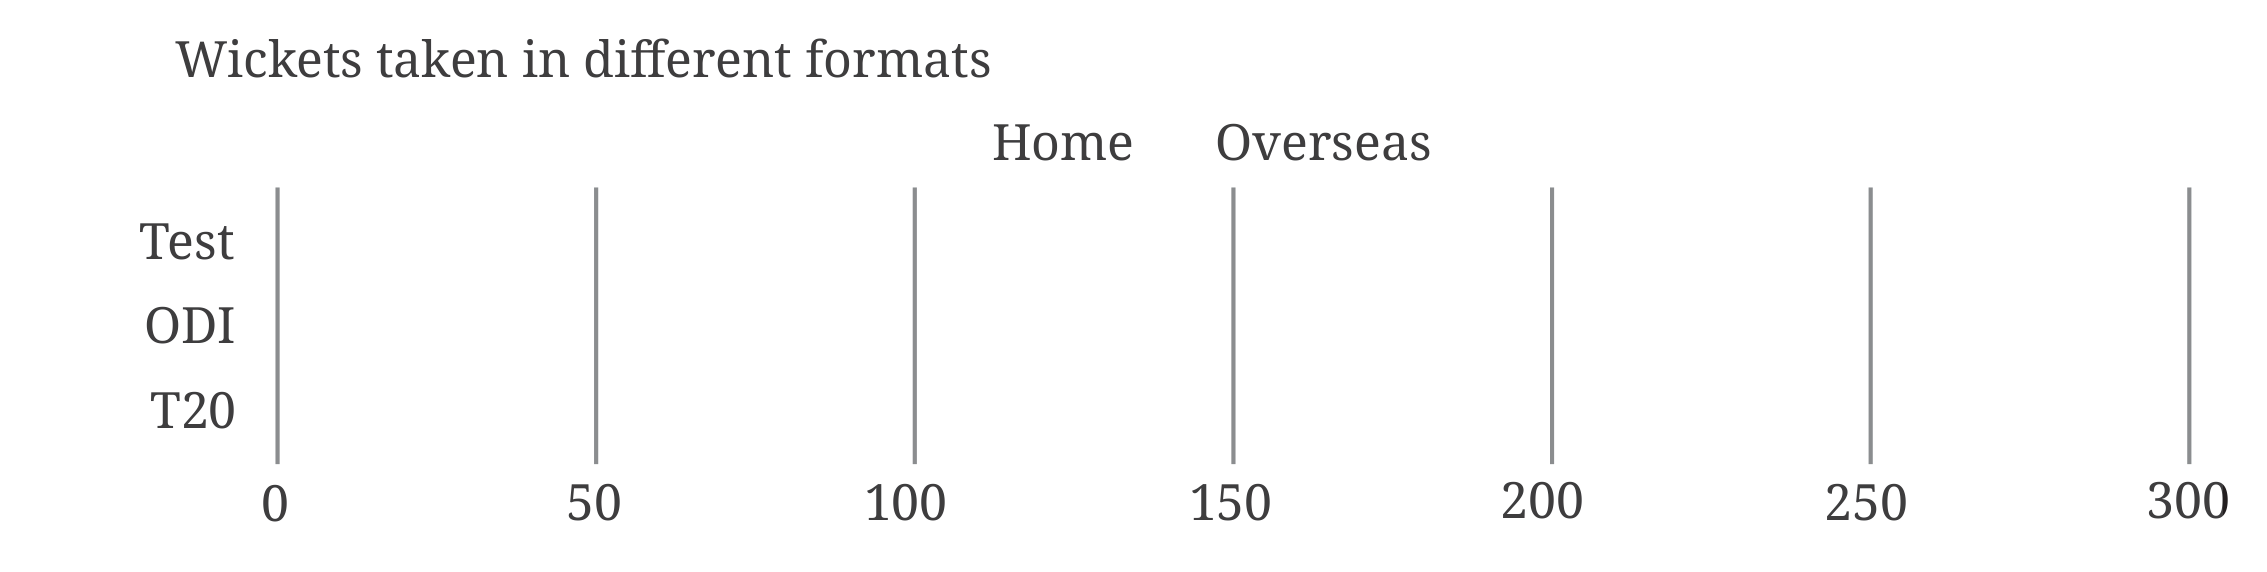
The wickets taken by a bowler in International Cricket matches till 2025 are shown in the table. Complete the given stacked bar charts (the bar lengths can be approximate),
(i) comparing the total wickets taken at home vs. overseas: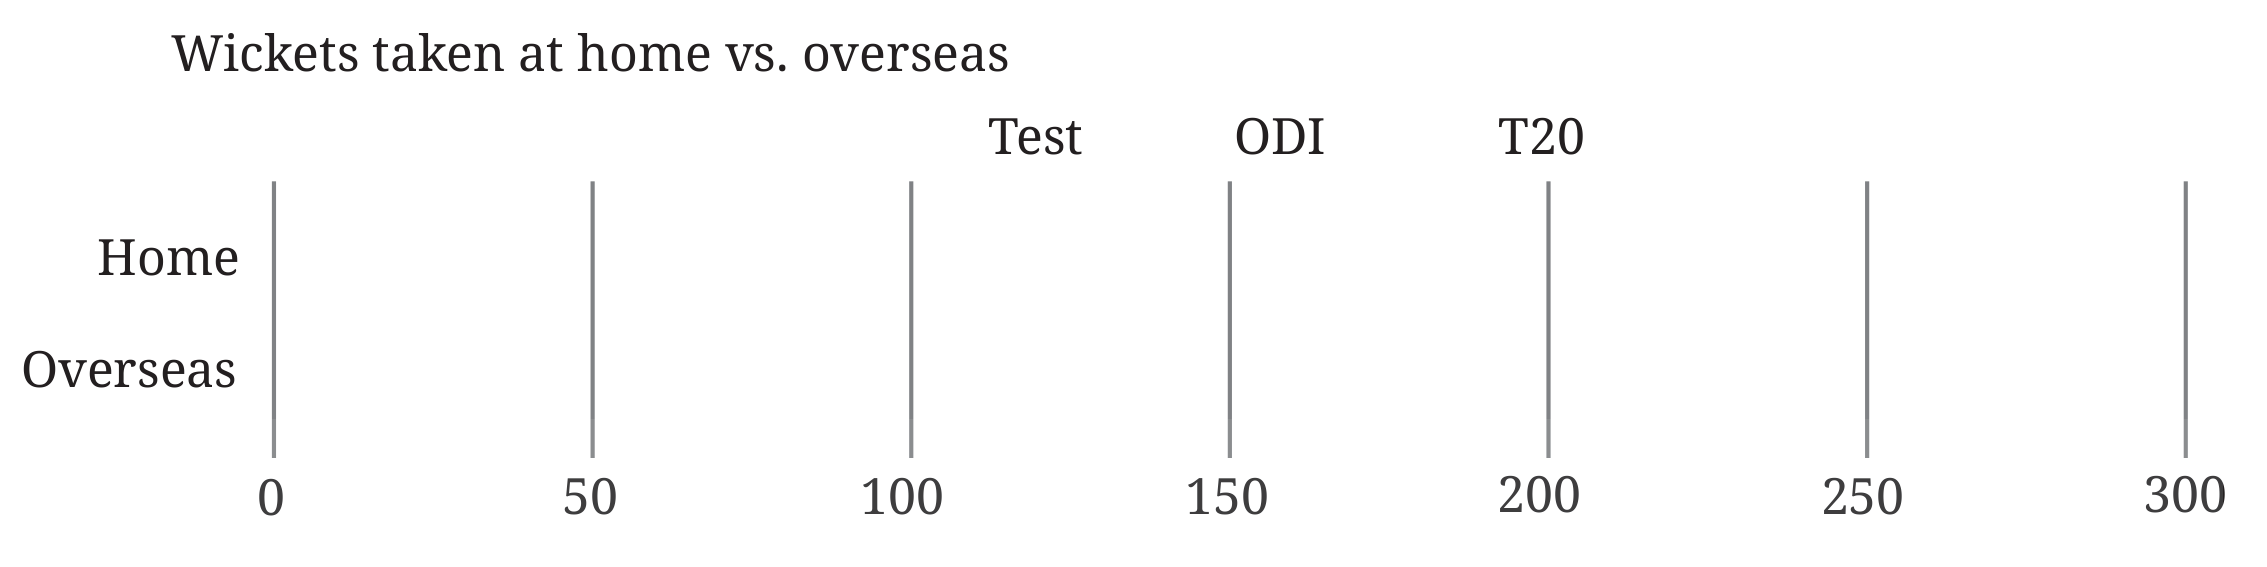 (ii) The total wickets taken in each format:
| Test | ODI | T20 | |
|---|---|---|---|
| Home | 62 | 100 | 32 |
| Overseas | 172 | 49 | 71 |
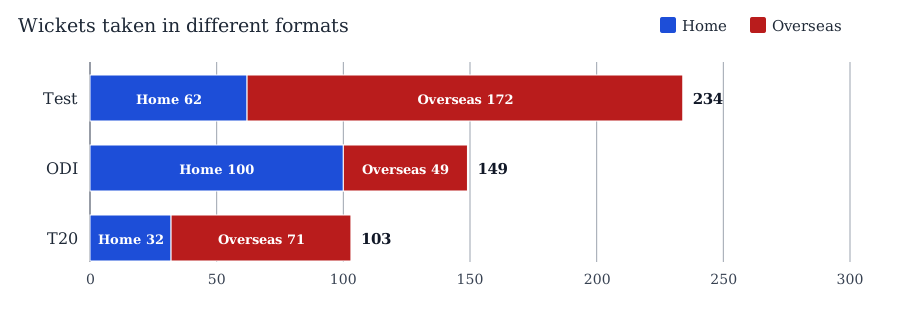
(ii) The total wickets taken in each format:School Level Solution
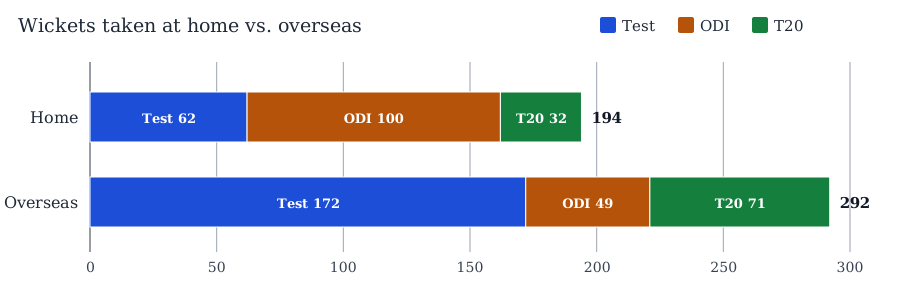 (ii) Totals by format:
Test = 62+172 = 234
ODI = 100+49 = 149
T20 = 32+71 = 103