
Class 9 · MathsNCERT 2026 Revised Syllabus
Chapter 10: How Quantities Combine: Understanding Data (0904CH10)
Exercise Set 10.5 — 1 questions with step-by-step notebook-style answers.
Jump to:
Exercise Set 10.5(1 questions)
1
The smart watch data of 5 people was tracked from Monday to Friday. The recorded data tells us how many hours each person spent lying down, sitting, and standing or moving around, etc., as shown in the following table.Table 10.3: Average number of hours spent per day (Monday–Friday) lying down, sitting, and standing or moving around, etc., of 5 people
(i) How much time does Sahana spend per day in each of these body-states? Make a reasonable guess and fill her row in the table.(ii) Guess what activity or work Julie could be engaged in based on the data. Find out what your classmates' guesses are.(iii) Complete the chart below based on the tabular data.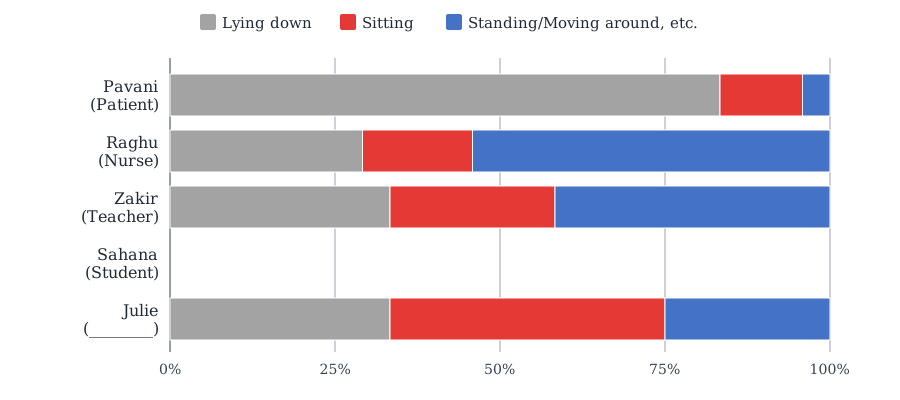
| Lying down | Sitting | Standing or Moving around etc. | |
|---|---|---|---|
| Pavani (Patient) | 20 | 3 | 1 |
| Raghu (Nurse) | 7 | 4 | 13 |
| Zakir (Teacher) | 8 | 6 | 10 |
| Sahana (Student) | |||
| Julie (________) | 8 | 10 | 6 |
School Level Solution
| Lying down | Sitting | Standing or Moving around etc. | |
|---|---|---|---|
| Sahana (Student) | 8 | 6 | 10 |
$\dfrac{20}{24} \times 100$ = 83.33%
- Sitting = $\dfrac{3}{24} \times 100$ = 12.50%
- Standing/Moving = $\dfrac{1}{24} \times 100$ ≈ 4.17% (sum = 100%)
- Raghu:
- Lying down = $\dfrac{7}{24} \times 100$ = 29.17%
- Sitting = $\dfrac{4}{24} \times 100$ = 16.67%
- Standing/Moving = $\dfrac{13}{24} \times 100$ = 54.17% (sum = 100.01%, due to rounding)
- Zakir:
- Lying down = $\dfrac{8}{24} \times 100$ = 33.33%
- Sitting = $\dfrac{6}{24} \times 100$ = 25.00%
- Standing/Moving = $\dfrac{10}{24} \times 100$ = 41.67% (sum = 100%)
- Sahana (from (i)):
- Lying down = $\dfrac{8}{24} \times 100$ = 33.33%
- Sitting = $\dfrac{6}{24} \times 100$ = 25.00%
- Standing/Moving = $\dfrac{10}{24} \times 100$ = 41.67% (sum = 100%)
- Julie:
- Lying down = $\dfrac{8}{24} \times 100$ = 33.33%
- Sitting = $\dfrac{10}{24} \times 100$ = 41.67%
- Standing/Moving = $\dfrac{6}{24} \times 100$ = 25.00% (sum = 100%)Completing that graph with Sahana's data: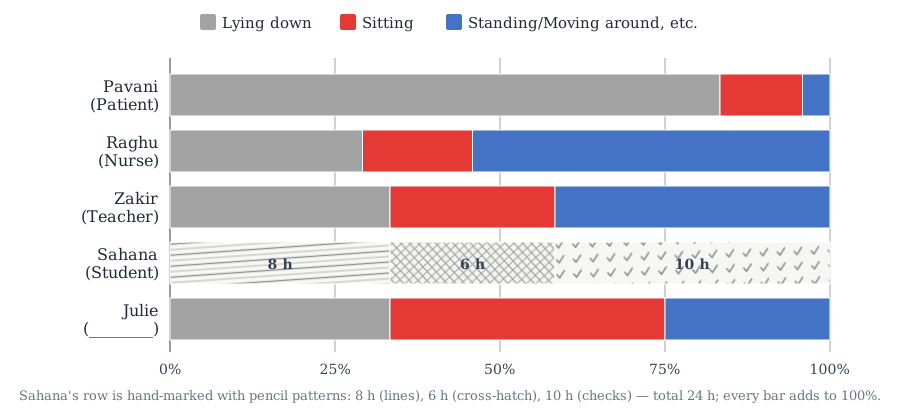 Tip for drawing: when rounded percentages are added, the total may come to 99.99% or 100.01% because of rounding (e.g. Raghu's row). Mark the segment boundaries using the exact hour fractions (
$\dfrac{x}{24}$ of the bar length), and the three segments will always fit the bar exactly.NoteSahana's row is only a reasonable guess and Julie's work is only an inference — answers may vary.