
SolveNCERT
SolveNCERT
HomeSolutionsMathsCh 10Think and Reflect
Class 9 · MathsNCERT 2026 Revised Syllabus

Chapter 10: How Quantities Combine: Understanding Data (0904CH10)

Think and Reflect — 13 questions with step-by-step notebook-style answers.

Think and Reflect(13 questions)

Page 8(1 question)

1
Why did Method 1 not work?

School Level Solution

Method 1 does not work because it treats the average heights of seniors and of juniors equally — but there are many more seniors than juniors!Method 1 simply averages the two group averages: (165.5 + 149.33) ÷ 2 = 157.415 cm. This gives the senior average and the junior average equal weight, as if there were equal numbers of seniors and juniors.But there are 8 seniors and only 3 juniors, so the seniors are most of the group. The combined average must lie much closer to 165.5 than to 149.33. Method 2 does it correctly: (165.5 × 8 + 149.33 × 3) ÷ 11 = 1772 ÷ 11 = 161.09 cm — a weighted mean where every student counts equally.Remember: never average averages unless the groups are the same size.

Page 26(4 questions)

1
What does this say about the scope of the stacked bars and 100% stacked bars?

School Level Solution

This says that stacked bars show actual quantities and totals, while 100% stacked bars show proportions only — percentages alone cannot tell the actual number. For example, Fatima's garden can have a higher percentage of blooms yet fewer actual blooms than Naveen's.
2
Given a stacked bar chart can we make a corresponding 100% stacked bar chart?

School Level Solution

Yes. We divide each segment by the bar's total and multiply by 100%. The new segments are the percentage shares, and the bar totals 100% — a 100% stacked bar chart.
3
Given a 100% stacked bar chart can we make a corresponding stacked bar chart?

School Level Solution

No, we cannot make a corresponding stacked bar chart because percentages alone do not tell the original totals: the same percentages can describe bars of very different sizes (in Case 1 both gardens had 42 blooms, yet the percentages were different).
4
What kind of inferences or comparisons can be made from a stacked bar chart and in a 100% stacked bar chart?

School Level Solution

From a stacked bar chart we can compare totals and the absolute amount of each category. From a 100% stacked bar chart we can compare the composition (percentage share of each category) within each total — but not the actual numbers.

Page 27(4 questions)

When we visualise the same data by grouping ages, we get the following stacked column chart:
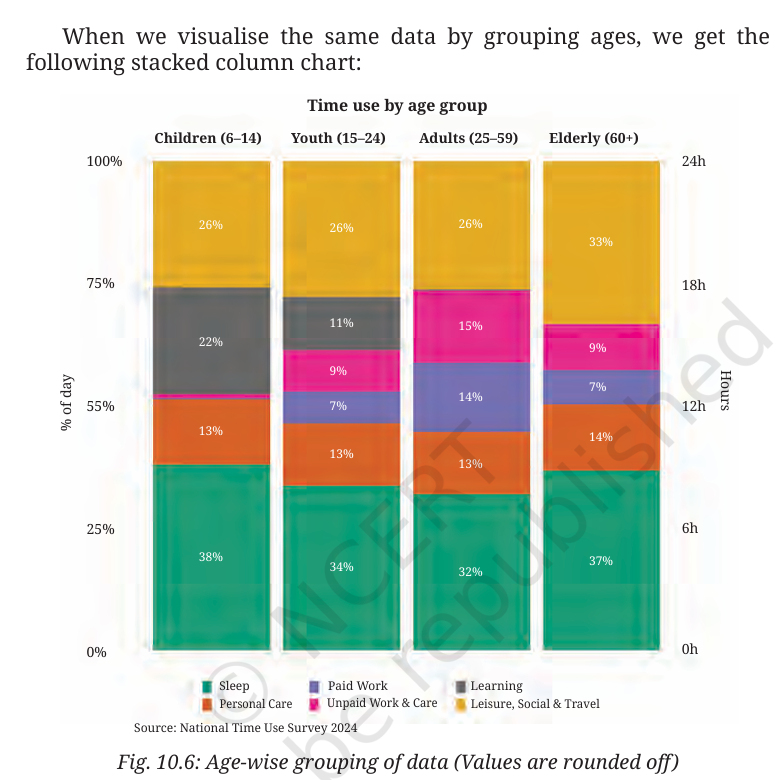
Fig. 10.6 Age-wise grouping of data
Fig. 10.6: Age-wise grouping of data (Values are rounded off). Source: National Time Use Survey 2024.
1
What do you find interesting in the chart above? What can you infer? Discuss.

School Level Solution

In Fig. 10.6, children (6–14 years) devote the largest share of their day to Learning, while the 15–24 group and adults devote most time to Paid Work and Unpaid Work & Care; sleep is the largest single block in every age group but slowly falls with age. We infer that activity patterns shift systematically across age — learning declines, work rises and sleep falls slightly.
2
Do you remember the sleep time over age trend that you studied last year? Does that trend align with this chart?

School Level Solution

Last year we read that sleep time steadily falls as age increases. The same trend is visible here: children sleep the most, the 15–24 group sleeps a little less, and adults sleep the least of the three age groups. The chart aligns with the known trend.
3
Can you explain why the learning time of people in the age group 15 – 24 has reduced significantly compared to that of the age group 6 – 14?

School Level Solution

For children aged 6–14, school is their main activity, so Learning takes up the largest share of the day. The 15–24 group is at the stage of higher studies, job hunting and early careers: many have left school, and they spend much more time in Paid Work (or preparing for it) and Unpaid Work & Care. So the time devoted to Learning falls sharply — not because learning becomes unimportant, but because the structure of the day shifts from schooling to work and other responsibilities.
4
Do adults spend about an equal amount of time in paid and unpaid work? What do you think?

School Level Solution

Yes. In Fig. 10.6, the Paid Work and Unpaid Work & Care segments of the adult groups are almost equal in size. Unpaid work — cooking, cleaning and care work — takes roughly as much time as paid work.

Page 28(1 question)

1
Do you remember the ‘What Can A Strip Say?’ activity from last year? In each strip, if we club the tiny strips belonging to each activity together, will we get a 100% stacked bar chart like the one in Fig. 10.6?

School Level Solution

Yes. A single strip represents one full day (24 hours). Clubbing the strips of each activity gives that activity's total time in the day, and the shares add to 100%. Each strip, drawn with equal total length and the activity segments placed consecutively, is a 100% stacked bar chart like Fig. 10.6.

Page 30(3 questions)

1
Will the bars look similar if a different teacher’s data is considered instead of Zakir’s?

School Level Solution

No. A different teacher's hours in each activity will differ — routines, travel, duties and home responsibilities are never identical. The bars will not look the same as Zakir's.
2
Will the bars look different if the data for all 7 days of the week is considered?

School Level Solution

Yes. The five-weekday chart clearly shows School on working days. Saturday and Sunday have no school, so over seven days the School share shrinks and Leisure, Social & Travel and Personal Care increase. The total remains 100%, so the bars look different.
3
Some bars in the chart may also match people doing other kinds of work/activities. Can you think of any? Discuss.

School Level Solution

Yes. Doctors/nurses (long work + study), police officers/soldiers (shifts + rest + travel), farmers (seasonal work), homemakers (large unpaid core) and shopkeepers (long paid hours plus family work) all mix work, unpaid care, sleep, personal care and leisure in the same building blocks. One day-chart alone cannot uniquely identify a job.

Other Chapters